Modal analysis is a fundamental technique in structural dynamics and testing that helps engineers and researchers understand how structures vibrate and respond to dynamic forces. Whether you’re working in aerospace, automotive, electronics manufacturing, or industrial testing, understanding the principles of modal analysis is essential for designing safer, more reliable products[1].
This comprehensive guide will walk you through the basics of modal analysis, from fundamental concepts to practical visualization techniques used in modern structural testing.
Modal analysis is the process of studying the dynamic characteristics of a structure—specifically its natural frequencies, mode shapes, and damping characteristics. These properties define how a structure responds when subjected to dynamic forces or vibrations[1].
Natural Frequencies
Natural frequencies are the frequencies at which a structure tends to vibrate freely after being disturbed. Every structure has multiple natural frequencies, each corresponding to a different mode of vibration. Understanding these frequencies is crucial because structures can be damaged if subjected to vibrations at or near these natural frequencies[1].
Mode Shapes
A mode shape is the pattern of deformation that a structure exhibits when vibrating at one of its natural frequencies. Different modes produce different deformation patterns. For example, a beam might oscillate in a simple up-and-down motion in its first mode, but twist or bend in more complex patterns in higher modes[1].
Damping
Damping is the inherent energy dissipation in a structure that causes vibrations to eventually cease. Materials naturally resist motion, converting vibrational energy into heat. Understanding damping characteristics helps engineers predict how long vibrations will persist after an excitation force is removed[1].
Why Is Modal Analysis Important?
Modal analysis serves numerous critical purposes in engineering:
- Product Design and Validation – Ensures structures can withstand intended operating conditions
- Problem Diagnosis – Identifies why structures vibrate unexpectedly or excessively
- Performance Optimization – Helps engineers modify designs to achieve desired dynamic behavior
- Safety Assurance – Prevents catastrophic failures caused by resonance or fatigue
- Quality Control – Verifies that manufactured products meet specification requirements
The Challenge: From Numbers to Understanding
Traditional vibration analysis relies on numerical data—frequency values, amplitudes, and phase angles. However, these raw numbers can be difficult to interpret intuitively. A technician looking at a spreadsheet of frequency response data might struggle to understand where on a structure maximum vibrations are occurring, how different parts of the component are moving relative to each other, or what the actual physical deformation looks like[1].
This is where visualization becomes invaluable. By converting abstract numerical data into visual representations of actual structural motion, engineers gain immediate insights that would take hours to extract from traditional data analysis.
Vibration Visualization: Bringing Data to Life
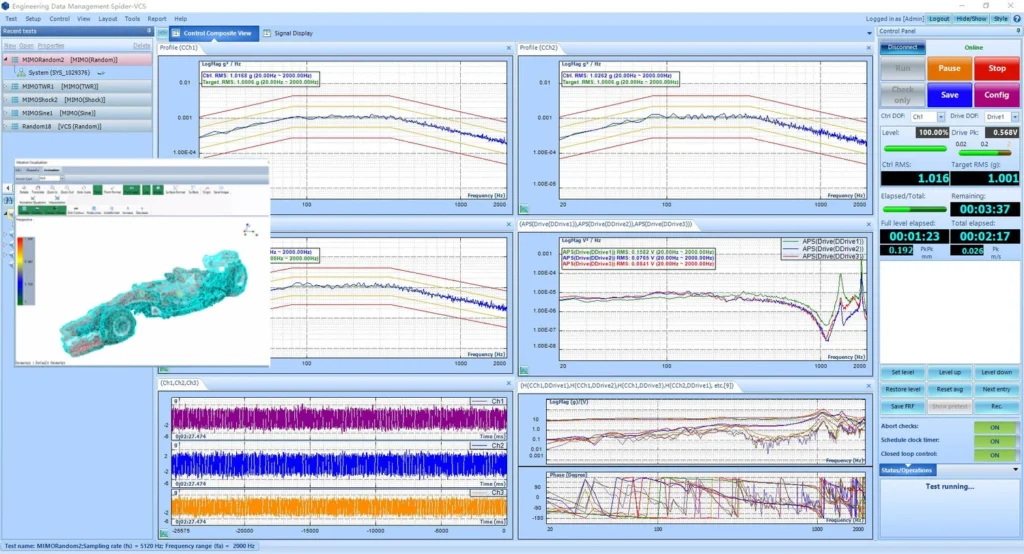
Modern testing and analysis software addresses this challenge through vibration visualization—animating the actual deformation of test structures based on measured vibration data. Instead of staring at numbers, engineers can watch a three-dimensional model of their test article deform in real-time, seeing exactly where maximum vibrations occur and how different modes of vibration affect different parts of the structure[1].
Visualization Benefits:
- Immediate Insight – Quickly identify problem areas and vibration hotspots
- Mode Identification – Clearly see how each natural frequency corresponds to a specific deformation pattern
- Real-Time Monitoring – Watch structural response develop during active testing
- Communication – Easily explain complex dynamic behavior to stakeholders using visual demonstrations
- Optimization – Make informed decisions about sensor placement and excitation location
Professional visualization tools use color-coded contour maps to represent vibration intensity across the structure. Typically, cool colors (blue) represent low vibration levels, while hot colors (red) indicate maximum vibration amplitude. This intuitive color scheme allows viewers to instantly identify which regions of a structure experience the greatest dynamic response[1].
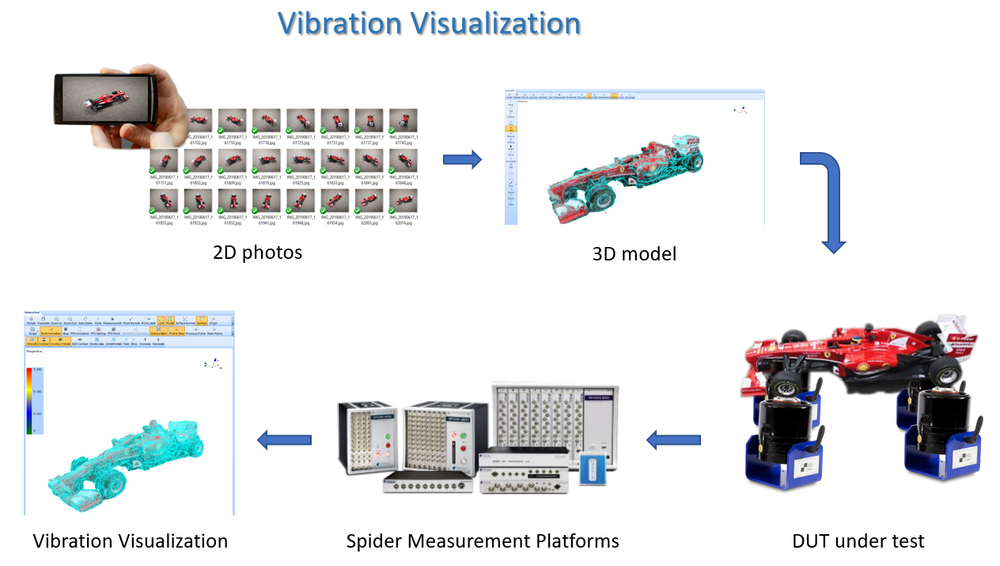
Creating 3D Models from Photos: 2D to 3D Reconstruction
The foundation of effective vibration visualization is an accurate three-dimensional geometric model of the test structure. Historically, creating such models required expensive CAD software, detailed technical drawings, or complex manual measurements. Crystal Instruments has revolutionized this process with advanced 2D to 3D reconstruction technology[1].
Step 1: Capture Photos
The process begins simply—using a smartphone or digital camera, photographers take 2D photographs of the test structure from multiple angles. For optimal results, photos should be captured at approximately 15-degree intervals around the object, resulting in approximately 24 photos for a complete 360-degree survey. Additional photos increase model accuracy but may require longer processing time[1].
Step 2: Load Images
The captured 2D photographs are imported into specialized reconstruction software where the system begins analyzing image data to match corresponding features and extract depth information[1].
Step 3: Feature Extraction
Using triangulation principles, the software compares overlapping regions in consecutive photographs to determine the three-dimensional depth of various features on the test object. The 15-degree interval between photos provides optimal overlap—enough to ensure accurate matching without excessive redundancy[1].
Step 4: Point Cloud Generation
The software creates two point cloud models:
- Sparse Point Model – A rapid, lower-resolution model that captures the overall geometry quickly
- Dense Point Model – A refined, high-resolution point cloud that captures fine geometric details[1]
Step 5: Surface Reconstruction
The dense point cloud is automatically transformed into a complete 3D surface model by connecting all points into a cohesive mesh. This produces a dimensionally accurate representation of the physical structure[1].
Step 6: Geometry Refinement
The resulting 3D model can be imported into a geometry editor where engineers can refine the model—removing unwanted elements (such as test fixtures or backgrounds), trimming edges, and improving overall aesthetics. The finished model is exported in a standard format (.vvm) for use in vibration analysis and testing software[1].
Real-Time Vibration Visualization During Testing
Once a 3D model is available, it becomes possible to animate structural vibration in real-time as testing occurs. Accelerometers or other sensors are attached to strategic locations on the test structure. As the structure vibrates during the test, measurement data from these sensors drives the animation of the 3D model[1].
The software uses sensor data to calculate the instantaneous deformation at each measurement point. Through advanced interpolation algorithms, the system then calculates the likely deformation at unmeasured points across the entire structure, creating a seamless animated representation of how the complete structure deforms during the test[1].
Two Animation Modes:
- Block Data Mode – Updates the animation every 40 milliseconds, providing an instantaneous display of structural deformation. Useful for seeing rapid dynamic response, though the structure may not reach full amplitude display.
- RMS (Root Mean Square) Data Mode – Displays the vibration level of each time block, making it easier to identify measurement points with maximum or minimum deformation. Better for observing overall deformation patterns.
Practical Applications During Testing
Real-time vibration visualization enables engineers to:
- Optimize Sensor Placement – Identify high-vibration and low-vibration regions to ensure sensors are placed where they matter most
- Adjust Excitation Location – Move the vibration source to achieve optimal response patterns
- Modify Control Profiles – Reduce test severity in areas showing excessive response, preventing damage to expensive test articles
- Monitor Test Progress – Watch the structure’s response develop in real-time and adjust test parameters as needed
Post-Test Analysis: Offline Visualization
The power of vibration visualization extends beyond real-time testing. After data collection is complete, recorded vibration data can be analyzed and visualized in multiple domains[1].
Time domain visualization replays the vibration data captured at each instant during the test. This mode shows the combined effects of all vibration modes and is excellent for monitoring the overall structural response throughout an excitation event. Global interpolation capabilities allow engineers to visualize deformation across the entire structure even though measurement points may be limited[1].
Perhaps the most powerful analysis mode, frequency domain visualization animates the mode shapes of the test structure at each associated natural frequency. Rather than seeing a superposition of all modes (as in time domain), frequency domain animation isolates and displays the deformation pattern for each individual mode[1].
This capability is transformative for understanding dynamic behavior:
- Clear Mode Identification – See exactly how the structure deforms at each natural frequency
- Design Optimization – Use mode shape information to modify mechanical characteristics and improve performance
- Damping Assessment – Observe the relative dominance of different modes and adjust damping to reduce unwanted vibrations
- Resonance Prevention – Understand which frequencies pose risk and design to avoid operational resonance conditions
Practical Example: Analyzing a Complex Assembly
Consider testing a racing vehicle body structure. Traditionally, a modal analysis might reveal natural frequencies at 45 Hz, 67 Hz, 120 Hz, and 180 Hz. Without visualization, engineers know only that resonances exist at these frequencies. But what does this actually mean for the vehicle’s behavior?
With vibration visualization:
- At 45 Hz, engineers observe the entire body flexing side-to-side
- At 67 Hz, they see the front end bouncing while the rear remains more stable
- At 120 Hz, they observe the roof twisting
- At 180 Hz, they see localized high-frequency vibrations in the door panels
Armed with this visual understanding, engineers can now make informed design decisions—reinforcing areas of concern, adjusting material properties, or modifying geometry to shift natural frequencies away from operating conditions[1].
Getting Started With Modal Analysis
Required Equipment and Software
- Accelerometers or other motion sensors – To measure structural response, such as the LDS B02Y36 triaxial accelerometer for precise vibration measurements
- Data acquisition system – To record sensor data, such as the Spider-80X dynamic measurement system or other Crystal Instruments hardware
- Analysis and visualization software – Such as EDM Modal, VCS, or DSA
- 3D reconstruction software – For converting photographs into geometric models
- Test excitation source – Shaker table, impact hammer, or other vibration source
- Calibration equipment – To ensure measurement accuracy
- Plan sensor locations carefully – Place sensors at strategic points that reveal important structural behavior
- Use adequate image resolution – Higher-resolution photographs improve 3D model accuracy
- Take photos at consistent intervals – The recommended 15-degree intervals balance accuracy with processing efficiency
- Document test conditions – Record environmental factors, boundary conditions, and any constraints affecting the structure
- Validate results – Compare visualization results with theoretical predictions or previous similar tests
- Iterate and refine – Use visualization insights to improve future test designs and analyses
The Future of Structural Dynamics Testing
Vibration visualization powered by advanced 3D reconstruction technology represents a significant evolution in how engineers understand and optimize dynamic systems. By transforming abstract numerical data into intuitive visual representations, this technology democratizes access to sophisticated structural analysis—making advanced testing capabilities accessible to engineers at all expertise levels[1].
Modern data acquisition systems like the Spider-80X combined with precision sensors such as the LNS B02Y36 triaxial accelerometer provide the foundation for accurate modal analysis and vibration visualization. These tools enable engineers to capture high-quality measurement data that drives meaningful visual insights.
As manufacturing becomes increasingly demanding, and product reliability becomes paramount, the ability to quickly visualize and understand structural dynamics will become ever more important. Whether you’re developing aerospace components, automotive systems, consumer electronics, or industrial equipment, modal analysis and vibration visualization are becoming indispensable tools[1].
Modal analysis is no longer purely a domain for specialists with years of experience deciphering complex data. Modern visualization techniques bring structural dynamics to life, revealing the patterns and behaviors that determine how real structures respond to dynamic forces. By understanding natural frequencies, mode shapes, and damping characteristics—and by leveraging powerful visualization tools—engineers can design better, safer, and more reliable products[1].
Whether you’re new to structural testing or looking to deepen your understanding of modal analysis, the combination of rigorous measurement data and intuitive visualization represents the best path forward in modern engineering practice.
If you have reached the end of article you have to be interested in modal testing or have similar interest for your profesional work. Bellow you will find a contact form, please use it to give me a fidback or ask for more detalis or like me to do for you similar test.
Best Regards Dariusz


[1] Crystal Instruments. (2024). Vibration Visualization for Structural Dynamics Testing. Retrieved from https://www.crystalinstruments.com/vibration-visualization-for-edm-modal
Leave a Reply